
THE SHORT VERSION
What you’ll take away.
- INP measures how quickly a page shows a response when someone clicks, taps, or types.
- Aim for 200 milliseconds or less: one-fifth of a second.
- Start with reports from real visitors, then try the slow menu, button, or form yourself.
- Find whether the delay happens before the action starts, while it runs, or while the screen updates.
- After a change, check that the feature works and that real visitors experience quicker responses.
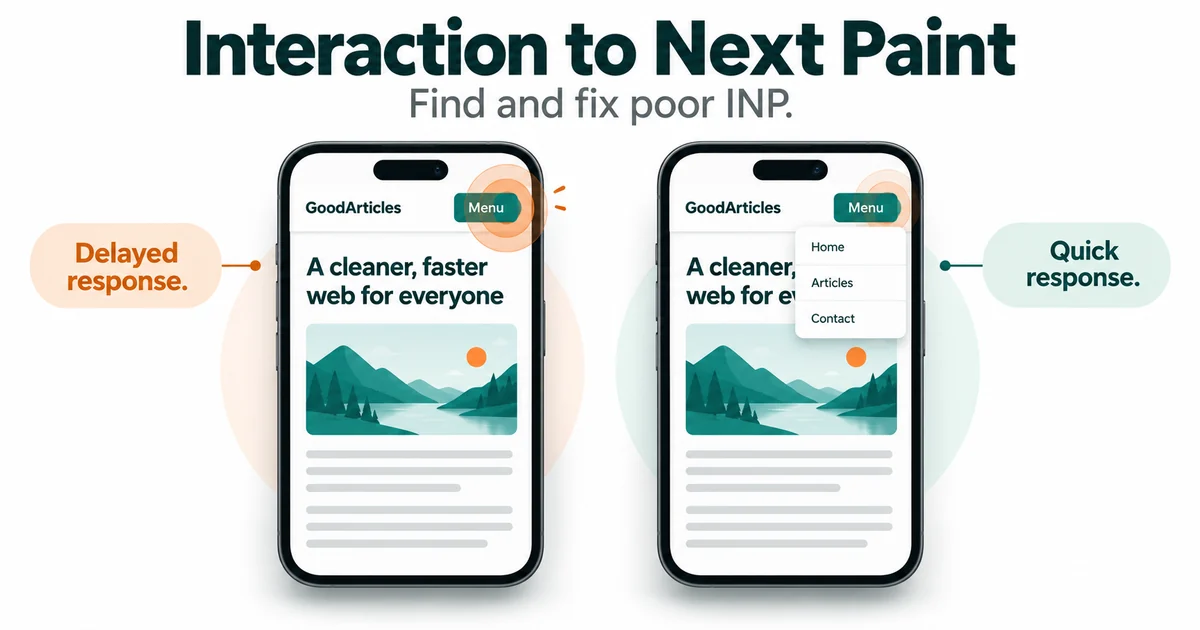
Interaction to Next Paint (INP) measures how long a page takes to show a response after someone clicks, taps, or presses a key. In this name, paint means the browser drawing the next update on the screen.
Imagine opening a website on your phone. The page appears quickly, but when you tap Menu, nothing seems to happen. You tap again. A moment later, the menu opens and immediately closes because both taps have finally been handled.
This guide explains what you can check as a website owner, how to find the action that feels slow, and what a developer can change to improve it.
What does INP measure?
INP looks at clicks, taps, and keyboard actions throughout a visit. Google’s INP documentation explains how these actions are measured.
For each visit, the result usually reflects the slowest response. On visits with many actions, the calculation can leave out a few unusually slow responses. It does not simply average all the clicks together.
Scrolling and moving the mouse over an item are not themselves measured as INP interactions. However, work they trigger can make a later click or tap slower.
A response can appear before the whole job finishes
Suppose you press Send on a contact form. The button can quickly change to Sending… while the website sends your message. Once that finishes, it can show Message sent or explain an error.
INP concerns the delay to the next screen update after your action. It does not measure the complete time needed to deliver the message or finish an order. The page should show an accurate response promptly, even when the full task takes longer.
How INP differs from LCP, CLS, and FID
INP is one of three Core Web Vitals measurements used by Google. Each checks a different part of the experience:
- Largest Contentful Paint (LCP) measures when the largest visible piece of content appears as the page loads, such as a large image or block of text.
- Cumulative Layout Shift (CLS) measures unexpected movement on the page, such as a button moving just as you try to tap it.
- INP measures how quickly the page responds to clicks, taps, and keyboard actions, such as opening a menu.
INP replaced First Input Delay (FID) as a Core Web Vital on March 12, 2024. FID checked only the wait before the first action started being handled. INP also covers later actions and the time needed to show the next screen update.
What is a good INP score?
INP is measured in milliseconds, written as ms. There are 1,000 milliseconds in one second, so 200 ms is one-fifth of a second. Lower values mean a quicker response.
| INP value | Classification |
|---|---|
| 200 ms or less | Good |
| More than 200 ms, up to and including 500 ms | Needs improvement |
| More than 500 ms | Poor |
Google assesses INP across recorded visits, with mobile and desktop results checked separately. It uses the 75th percentile to judge the result.
Think of it this way: imagine 100 mobile visits with INP data. To be in the good range, at least 75 of those visits should have an INP of 200 ms or less.
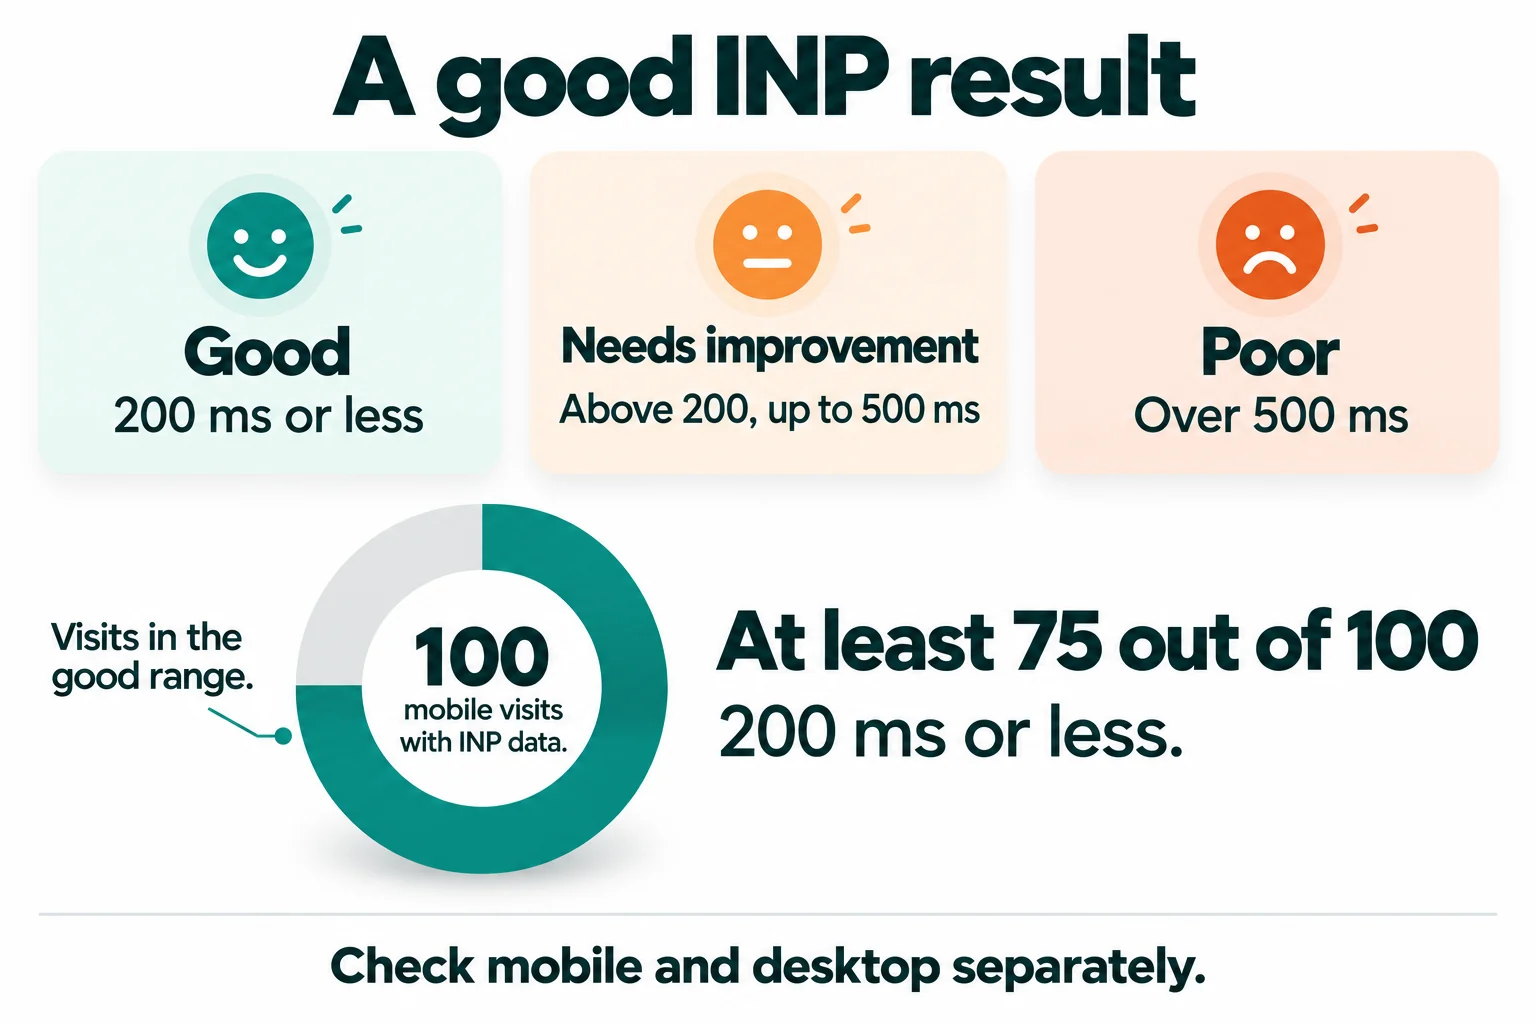
Remember that each visit has its own INP value based on the actions during that visit. The report brings many visits together. One quick click on your laptop cannot tell you how the page feels to people using different phones.
1. Find pages with slow responses
Start with information from real visitors. Testing tools call this field data. It shows how the website performs on the devices and connections people actually use.
A lab test checks a page under chosen test conditions. It helps you repeat a problem and investigate its cause.
Start with Search Console and PageSpeed Insights
In Search Console, open the Core Web Vitals report. Choose mobile or desktop and look for an issue that specifically names INP. A page group can also be marked poor because of LCP or CLS, so check which measurement needs attention.
Search Console puts similar page addresses, or URLs, into groups. For example, several product pages may use the same layout and menu. An example page in the report gives you somewhere to start, but you should check a few pages in that group.
Next, enter the address of an affected page into PageSpeed Insights and look at its real-user experience section. Check three things:
- Whether the data describes that one page or the wider website address, labelled as the origin.
- Whether you are viewing mobile or desktop results.
- The INP value and the reporting period.
For example, https://example.com/shop/shoes/ is a page address. Its origin is https://example.com. A result for that origin covers visits across pages under that address.
PageSpeed Insights uses real-visitor information from the Chrome User Experience Report, also called CrUX, covering the previous 28 days. If a page has too little data, the tool may show results for the origin instead. Check that label before assuming the number belongs to one article or product page.
A high performance score does not tell the whole story
PageSpeed Insights also runs a Lighthouse test, which produces a 0–100 performance score. Its default page-load test does not click through your menus, forms, and filters. This score is separate from the INP result based on real visits.
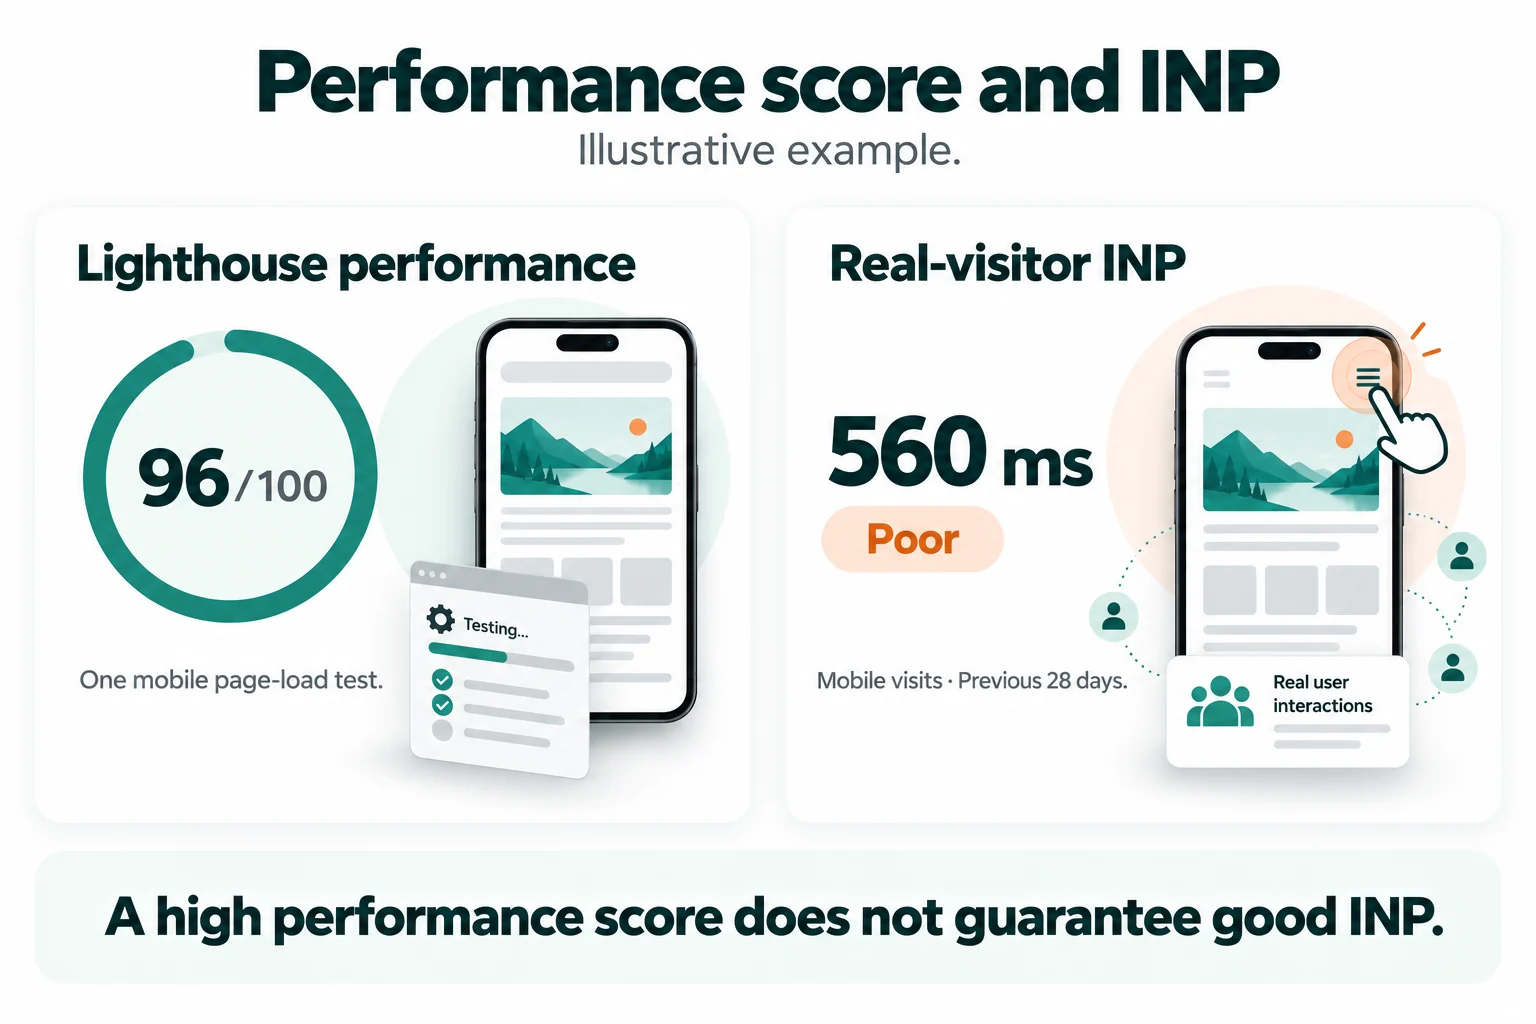
You may also see Total Blocking Time (TBT). This can indicate that the browser is busy during loading. It is a useful clue, but it is a different measurement from INP.
If real-visitor data is missing, you can still try common actions and fix delays you can repeat. You will need more visitor data to judge the wider result.
Start with an important task that visitors struggle to complete, such as opening a menu or submitting a contact form. If the same problem affects several pages, investigate the feature they share.
2. Try the slow action yourself
Choose one task a visitor needs to complete. Open the menu, search for a product, change a filter, or submit a contact form. Write down the steps that lead to the delay.
Check whether the problem happens:
- On the first click or tap, on later attempts, or both.
- While the page is still loading or after it has been open for a while.
- On your phone, your computer, or both.
- On one page or on several pages with the same feature.
For example, a menu might work well after loading but pause when you tap it immediately after opening the page. Waiting until the page has settled would miss that problem.
Try the same steps more than once. Advertising, chat tools, a cookie notice, or an earlier action can change how busy the page is at that moment.
Check the action in Chrome’s built-in tools
On a computer, open the page in Chrome. Right-click it, choose Inspect, and open the Performance panel. These built-in testing tools are called DevTools.
Start with the panel’s live metrics view. Try the action and check the interaction timings shown as you use the page. These describe your test on this device; they do not replace the result from real visitors.
For a closer look, make a performance recording, also called a trace:
- Start recording before the action. For a problem during loading, use Record and reload, then perform the action while the page loads.
- Once the action has responded, stop recording if it is still running.
- Find your action in the Interactions row. Hover over it to see its duration and the timing breakdown explained below.
- Save the recording so your developer can inspect it and compare it with a later test.
For a developer: The Main track and Bottom-up view help identify which jobs took time and which scripts were responsible. Note the specific cause, such as a chat widget starting up before the menu’s code could run.
Try the action on an actual phone as well. A developer can use CPU throttling to slow a computer-based test and imitate a less powerful device. It is an approximation, so phone checks still matter.
If you cannot repeat the reported delay, ask your developer about monitoring real visits to identify the slow action and device. A fast result on your computer does not rule out a problem for other visitors.
If you need help, send a clear description along with the recording. For example:
On our product pages, the menu pauses on the first tap while the page is loading. A second attempt is quicker. I can repeat it on my phone, but not on my laptop. Here are the page address and the steps I followed.
3. Find out where the delay happens
A browser has many jobs to do. These include running JavaScript, the code used for features such as menus and filters, and preparing screen updates. Much of this work happens in a part of the browser called the main thread.
Think of that thread as one worker handling several jobs. If the worker is occupied with a long job, a new request has to wait, even when the request itself is quick.
DevTools divides an interaction’s time into three parts:
| Part | What happens | What to investigate |
|---|---|---|
| Input delay | Your click waits before the browser starts handling it. | Other jobs already keeping the browser busy. |
| Processing duration | The browser runs the code needed to handle your action. | A button or feature that starts too much work. |
| Presentation delay | The browser prepares and draws the next screen update. | A change that takes too much work to display. |
Imagine a menu taking 620 ms, or a little over half a second, to respond. In this example, the time is split into:
- 380 ms waiting while the browser finishes another job.
- 120 ms handling the menu action.
- 120 ms preparing the screen update.
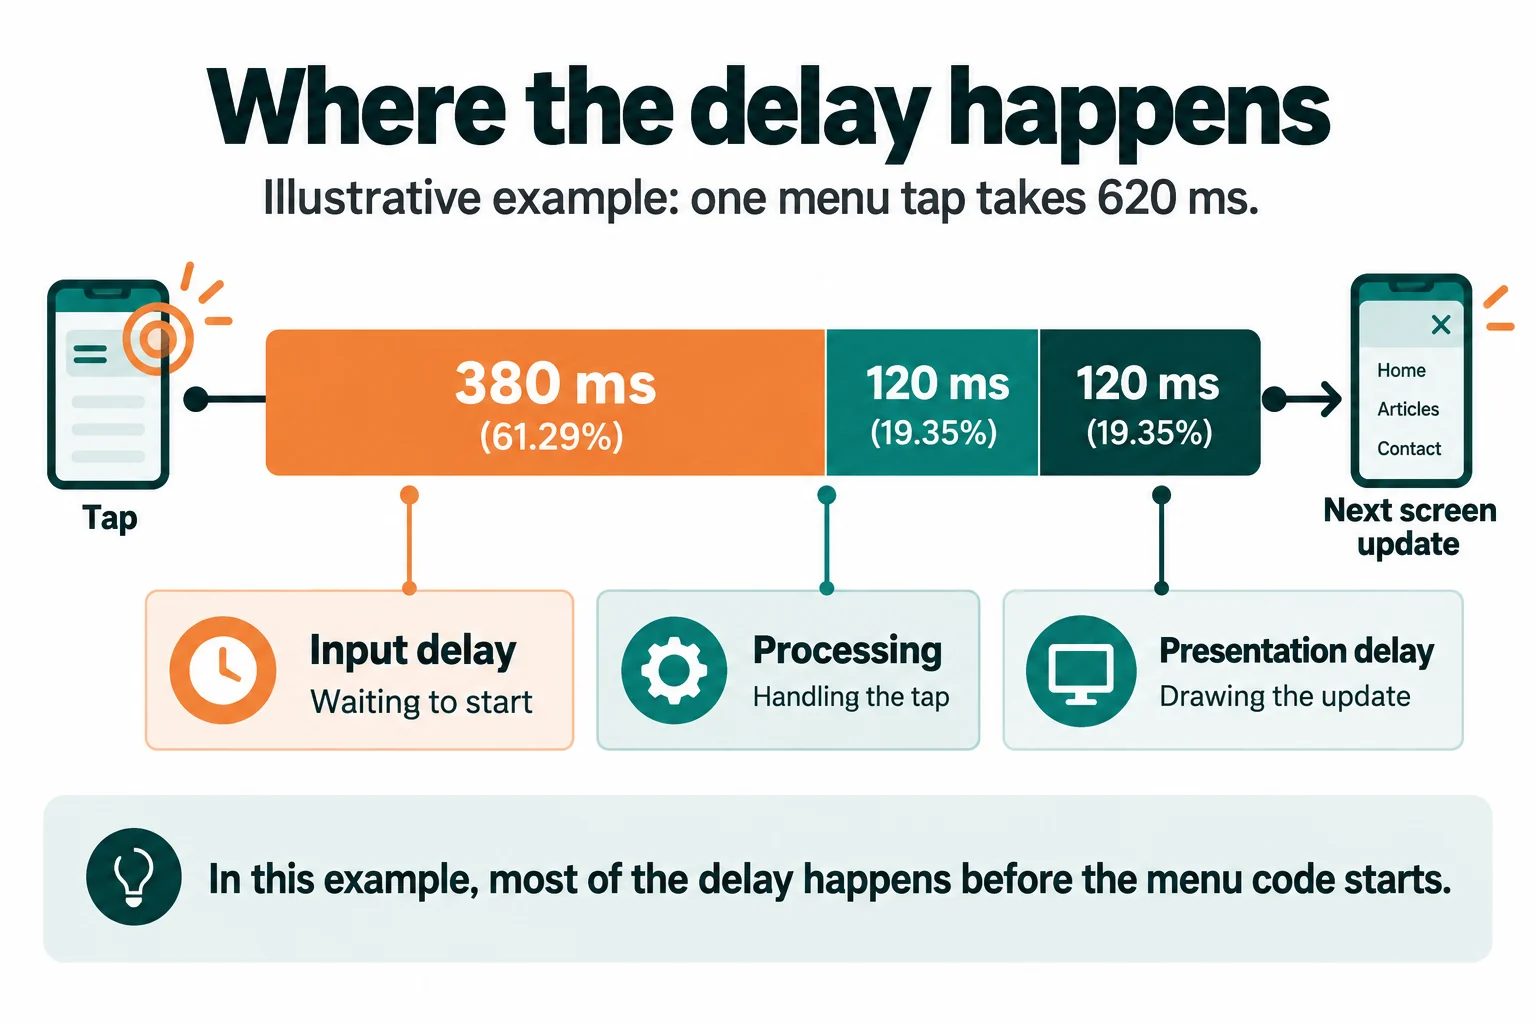
Start by investigating the 380 ms wait, which is the largest part. If the recording shows a chat widget starting up during that wait, investigate its work. Then check the time spent handling and displaying the menu. The recording should guide the change, rather than a guess about which feature is responsible.
These numbers illustrate one slow action. A report needs information from many visits to judge the wider INP result.
4. Choose a fix that matches the cause
Use what you found in the recording to choose a change. The size of a script or the number of plugins installed does not tell you which job delayed the button.
If the click has to wait, reduce other work
The browser may be busy starting features, running advertising code, or repeating a background job. DevTools calls a job that occupies the main thread for more than 50 ms a long task.
The 50 ms label describes one browser job. The 200 ms INP goal covers the whole interaction, including its wait and screen update.
Look for work that the page does not need, duplicate scripts, and outside services that run at the same time as the slow action. A developer can also split a long job into smaller pieces, giving the browser chances to respond between them.
Check settings that delay scripts until the first click or tap. For example, a page might start its chat tool, social sharing buttons, and several other features as soon as someone first touches the menu. Moving all that work to the first tap can make that tap feel slow.
Test the first tap as well as later attempts. A setting that helps the page load can still leave work to do when someone starts using it.
If the action itself is slow, make it do less
The code that responds to an action is called an event handler. Opening a menu should require only the work needed to open that menu. If the same click also rebuilds an unrelated product list, the browser has more work to finish.
Ask your developer to keep the work needed for the immediate response small and handle other necessary jobs separately.
Search boxes offer another useful example. As someone types shoes, the page might recalculate a large results list after every letter. Waiting for a short pause before updating the results can reduce repeated work. This technique is called debouncing.
The letters should still appear promptly as the person types. The pause applies to updating the results, rather than to showing the typed text. Adding a delay to every button click would create another slow response.
If the screen update is slow, simplify the change
Sometimes the code handles the click quickly, but the browser takes too long to draw the result. Developers call the work of preparing and drawing the page rendering.
For example, a product filter might try to display hundreds of product cards at once. Showing a smaller group on each page can reduce the amount the browser has to draw in one update.
Keep the other products accessible through working links between result pages. That gives visitors and search engines a way to reach items beyond the first group.
For a developer: Check whether the code repeatedly changes page sizes and then asks the browser to measure them again. This can force extra layout calculations, which work out where each part of the page belongs. Taking measurements together before making changes can reduce that repeated work.
For a longer job, show an accurate message such as Updating results… promptly. Then check that it actually appears. Changing a label in code and immediately starting another long job can keep the browser too busy to display the label.
Where to start on WordPress and Blogger
On WordPress, look for a feature shared by the slow pages. They may use the same menu, cookie notice, search box, or form. A problem in that shared feature could affect many pages.
Use a private test copy of the site, often called a staging site. If the recording points to an optional widget or plugin, temporarily turn it off there and repeat the slow action. Compare one change at a time to see whether it affects the delay. A developer may need to inspect the code if the problem remains.
On Blogger, start with the theme and any added gadgets, ads, chat tools, or video players that appear in the recording. A developer may need to change a script in the theme’s XML template, which contains the theme’s code. Other changes may be available in a gadget’s settings.
On either platform, check that the feature still works. A menu should open, close, and work with a keyboard. A form should explain missing information and send a valid message. Improving the number is useful when visitors can still finish their task.
Check whether the change helped
Repeat the original steps using the same device and test settings. Compare how long the response takes and where the time is spent. Several similar tests give you a clearer picture than one unusually fast attempt.
Check another page with the same feature. Try the first tap, later taps, and actions taken while the page is loading. A quicker menu response may still leave a separate problem in a search box or product filter.
Once the change is on the public website, record the date. Watch any visitor monitoring you have, then return to PageSpeed Insights and Search Console as their data updates.
Remember that the 28-day report initially includes visits from before and after the change. For example, a fix added yesterday will be mixed with many days of older visits. The report does not immediately show only the new version.
Compare mobile with mobile and desktop with desktop. Also check whether the result covers one page, a page group, or the wider origin. A quicker test is encouraging; the visitor data helps show whether the improvement holds across recorded visits.
Frequently asked questions
Will caching or a CDN fix poor INP?
Caching keeps reusable copies of files or page content so they can be delivered more quickly. A content delivery network (CDN) can serve files from locations closer to visitors. Both can help loading, but the effect on INP depends on what causes the delay.
If a menu waits because its code is doing too much work, faster file delivery alone will not remove that work. Check the slow action before choosing a fix.
Why is there no INP value for my page?
A visit may have no INP value if the person never clicks, taps, or uses the keyboard. Public reports also need enough visitor data to show a result for a page. A missing score does not mean the page scored zero or passed the check. You can still test its important menus, forms, and buttons.
Does a good INP score guarantee better rankings?
Google uses Core Web Vitals alongside other information when ranking pages. A good INP score does not guarantee a higher position, and useful, relevant content still matters. Check that the change also helps people use your menu, form, or search box without a frustrating wait.
JOIN THE CONVERSATION
Comments
Have a question or something to add? Comments are moderated and appear here only after approval.
JavaScript is required to submit a comment. Published comments above remain available to read.
No approved comments yet. Be the first to join the conversation.