
THE SHORT VERSION
What you’ll take away.
- AI impressions count appearances of your links; clicks and website actions help explain what follows.
- You get a clearer comparison when the page, dates, country, and devices match.
- A useful review leaves you with one clear question or a specific improvement to make.
Seeing your website linked in an AI Overview is encouraging. You’ve put work into that page, and now it’s helping Google answer someone’s question. Once you’ve noticed it, though, you’ll probably want to know whether it was a one-off appearance or something that happens regularly.
And then there’s the question that matters to your website: are those appearances bringing people to your pages, and what happens when they arrive? Someone can see a link in an AI answer without clicking it, so a rising visibility graph won’t answer everything on its own.
Google Search Console’s dedicated AI report gives you a place to start. Google announced the Search Generative AI performance reports on June 3, 2026, and confirmed the worldwide rollout on August 31. Their data also remains part of overall performance reporting. You can find the rollout details in Google’s announcement.
We’ll work through the reports together, following one page from its AI visibility to its wider search performance and website activity. The aim is to help you understand what you’re seeing and decide what deserves your attention next.
The screenshots have identifying details redacted and use different reporting periods. They show you where to look; the worked example later uses fictional figures. Documentation checked on September 14, 2026.
What the AI visibility report can tell you
When you first open the Generative AI performance report (Search), the number to pay attention to is impressions. It tells you about appearances of your links in AI Overviews and AI Mode under Google’s counting rules. An impression doesn’t mean someone visited your page, and ten impressions don’t necessarily mean ten different people saw it.
You can explore the data by Pages, Countries, Dates, and Devices. The current documentation doesn’t describe a separate AI Overview-versus-AI Mode breakdown, a query list, or dedicated click, CTR, and position metrics. If you’ve been looking for those extra tabs, that limitation explains why this guide focuses on combined visibility. Google’s report documentation sets out the available measurements.
As you move through the reports, you’ll be answering three related questions:
| What you want to know | Where you’ll find useful evidence |
|---|---|
| Is my content appearing in Google’s AI answers? | The Generative AI performance report for Search |
| Are people reaching this page from Google Search overall? | The regular Search results performance report |
| What do visitors do once they arrive? | Your website analytics |
Together, these views give you more context than any one graph. Just keep their labels clear: more AI impressions alone won’t tell you whether an enquiry or sale came from an AI answer.
Finding the report for your website
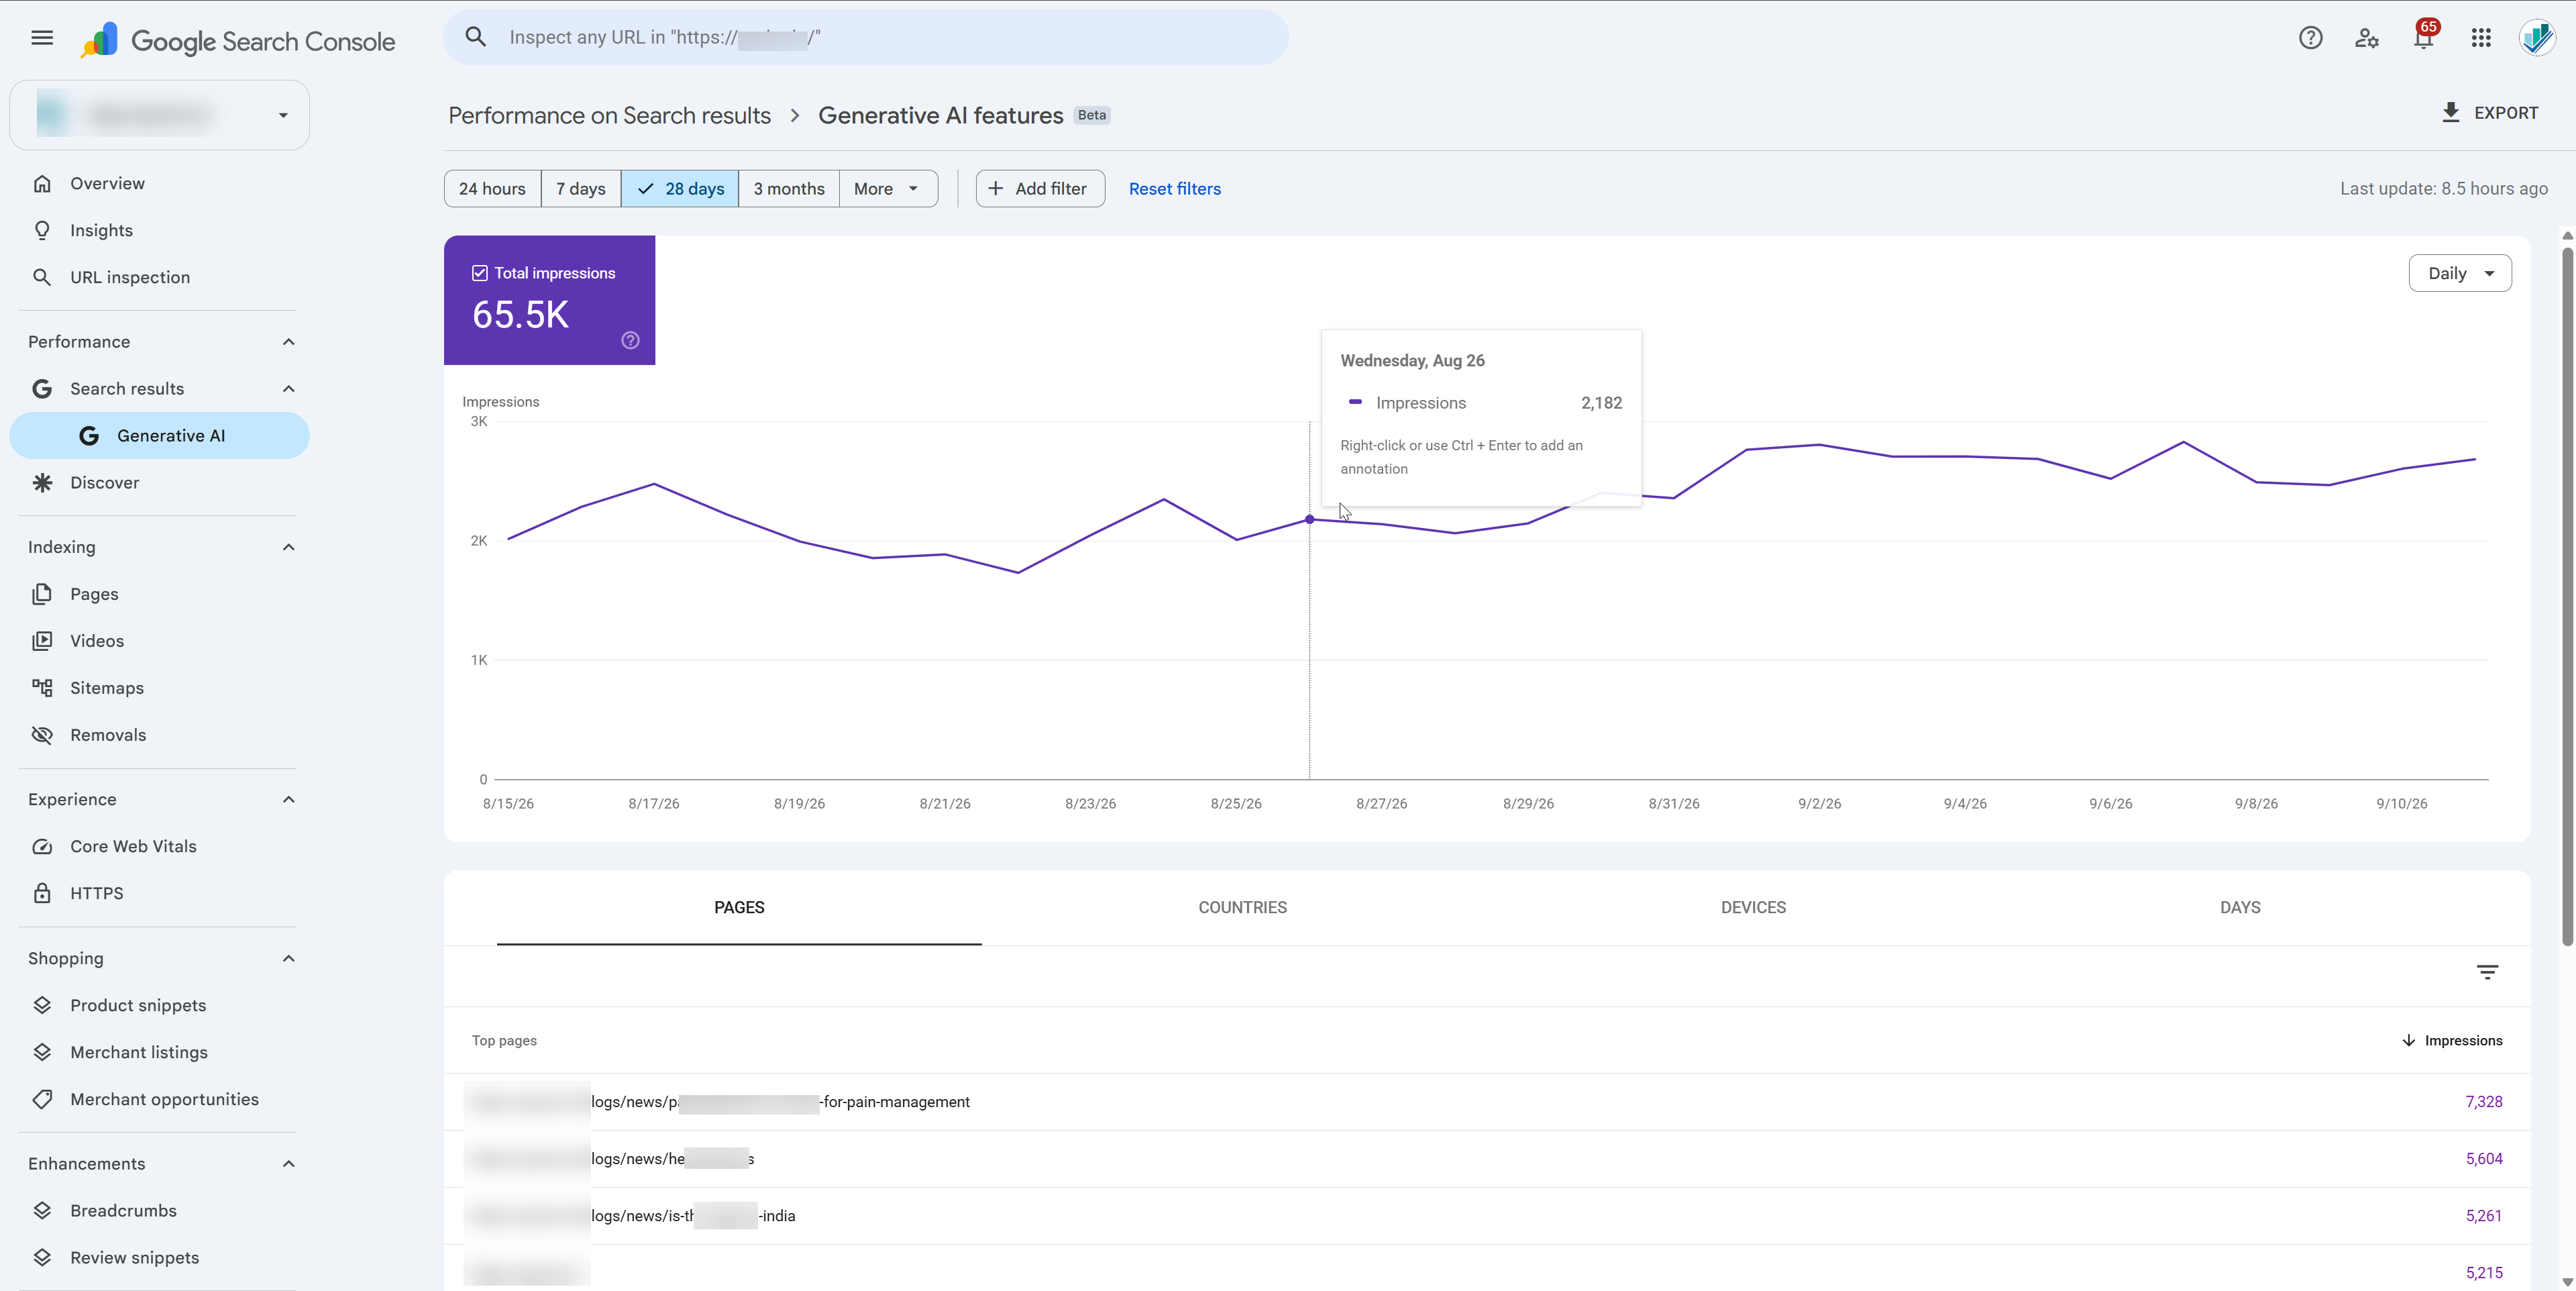
With your website’s property selected in Search Console, look under Performance, expand Search results, and choose Generative AI. In the screenshot below, the heading is Generative AI features, with a Beta label. Google’s direct link to the AI performance report can also take you there once you’re signed in to an account with access.
The report we’re using is for Search. Google also has a generative AI report for Discover, so it’s worth checking the heading before you start comparing figures.
Before looking closely at the graph, take a moment to check the property and filters. It’s easy to leave a page filter active from an earlier visit. You could then be looking at one article’s results while assuming the total covers your whole website.
Give yourself a fair comparison
A graph becomes much more useful when you know what you’re comparing it with. For a monthly review, 28 complete days alongside the previous 28 days is a manageable starting point, as long as both periods contain data. You don’t have to use that window; it simply gives you a consistent routine.
If your property has only just started showing AI data, you can begin by saving what is available. That first set of figures will give you something to compare with later.
The same idea applies to filters. A mobile-only report for India and an all-device worldwide report describe different audiences, even if their dates match. Keeping the page, country, and device settings consistent makes it easier to understand a change.
You can save or export each period separately. A short note beside the figures is enough: the property, URL, both date ranges, filters, export date, and any content or tracking changes made during that time. Next month, those details will save you from trying to remember how you produced the report.
Be a little patient with the newest figures. Google says recent data can be preliminary, and an unavailable value shown as a dash may become a zero in an export. If today’s graph looks unusually low, check whether the day and its reporting are complete before drawing a conclusion. Google’s data guidance explains these details.
Start with one page you care about
The Pages table can give you plenty to investigate. You don’t need to work through every row in one sitting. Start with a page you know well, especially one that matters to your business or answers an important question for your readers.
Perhaps it’s a tutorial that used to receive steady attention and has recently changed. Or a newer guide is beginning to appear in AI answers, and you’d like to understand what’s happening. Either gives you a more useful starting point than choosing a page simply because it has the smallest number.
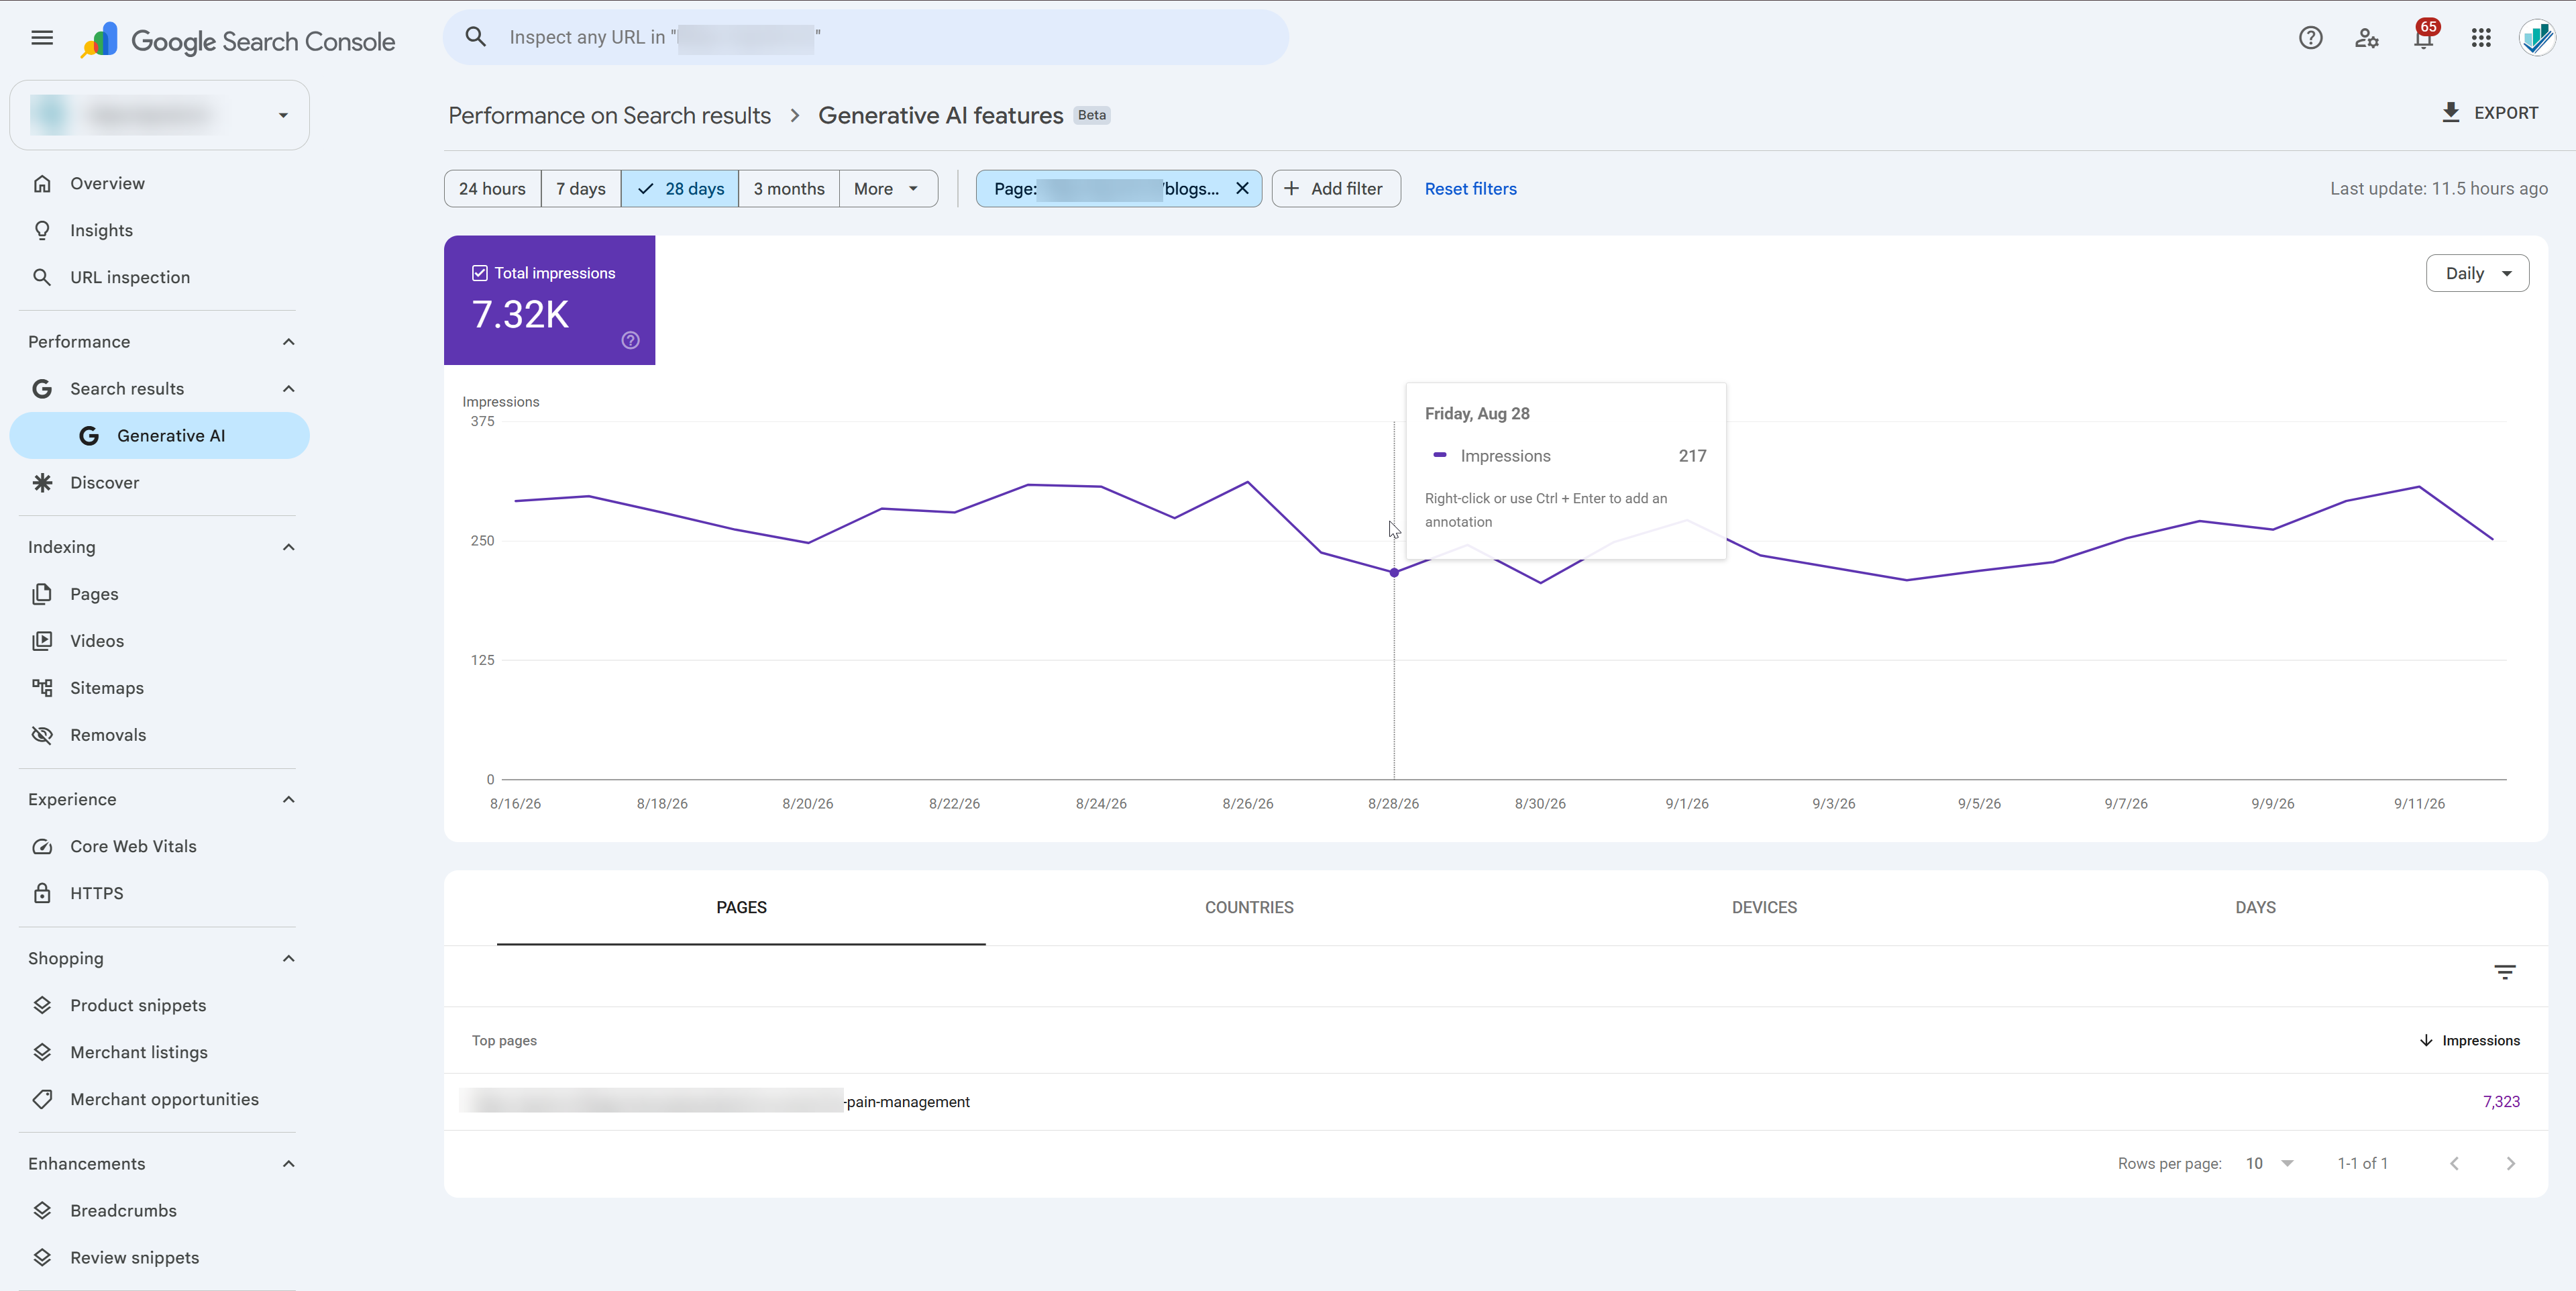
Once you’ve chosen it, apply a Page filter and check that the table shows the URL you intended. Now you can follow that page’s impressions without the rest of the website’s activity getting mixed into the total.
Then open the article itself. Imagine arriving with the question it promises to answer. Can you follow the explanation and finish the task? Our guide to writing an SEO-friendly article can help you review the content from that perspective.
For example, someone reading a server-error tutorial probably wants to identify the error, fix it, and check that the fix worked. A long introduction about the importance of website performance might leave them scrolling for the part they need. Looking at your above-the-fold content helps you see whether the first screen makes the page’s purpose clear.
You now have two things to work with: the report’s observation and your own assessment of the page. An impression count can draw your attention to an article; reading it helps you decide whether anything needs to change.
When the URL you expect isn’t there
Before assuming a page has disappeared from search, check whether its data belongs to another version of the URL. Search Console generally assigns performance data to Google’s selected canonical address. An old path, a parameter variation, or a duplicate URL may therefore show less than you expect.
This can be particularly confusing after a migration. You may still have the old WordPress address in your notes while Google reports against its replacement. Following the redirect and checking the canonical details can help you connect those two addresses to the same article.
If you’re unsure which signals to review, Google’s canonicalization guidance explains the roles of redirects, canonical annotations, and sitemaps. Once you’ve identified the right URL, use it consistently in your reporting notes.
Put AI visibility beside your Google Search clicks
At this point, you know how often the page appeared in the AI report. You’ll probably want to see whether its search traffic moved in the same direction. That’s where the regular Search results report becomes useful.
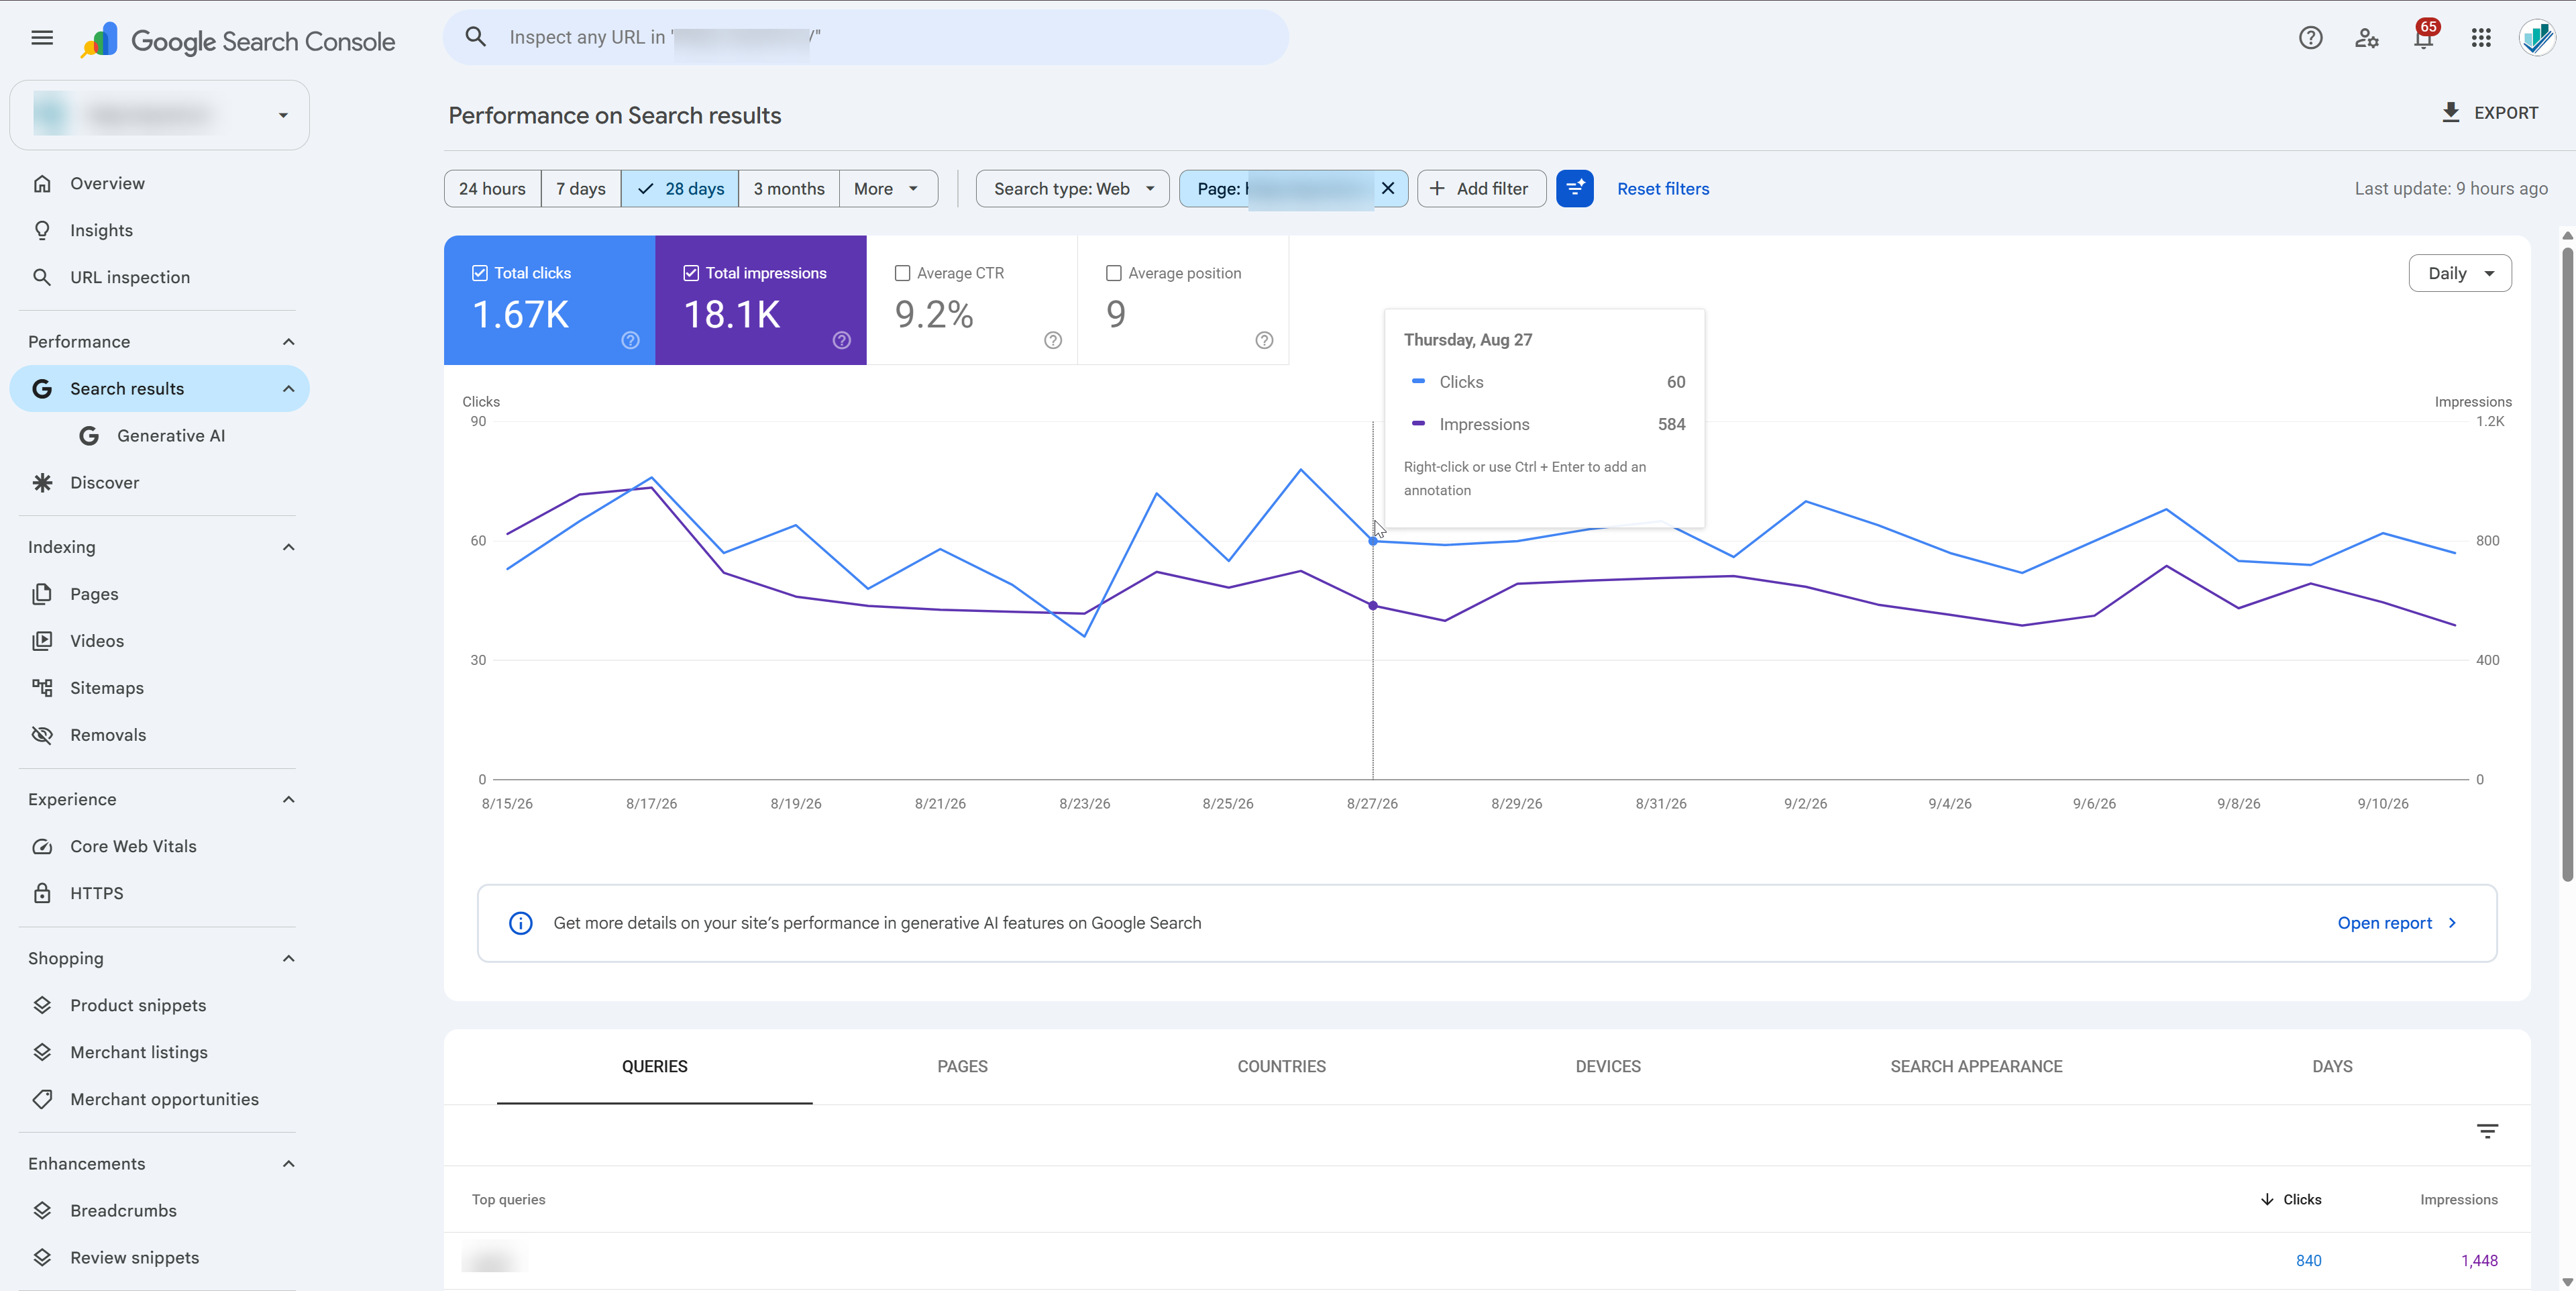
Choose the same page and dates there, with matching country and device filters. You can then place its overall Google Search clicks beside its AI impressions and see how the two trends developed.
There’s one easy mistake to avoid here: those clicks cover the page’s Google Search performance overall. Dividing them by its AI impressions won’t give you an AI click-through rate, because the two numbers cover different sets of appearances and clicks.
Google does count clicks on external links in AI Overviews and AI Mode. Its measurement rules also explain that an AI Mode follow-up is counted as a new query, while links inside one AI Overview share its search position. That shared position isn’t a ranking of the individual links within the answer.
When impressions rise but clicks fall
Suppose you’ve updated a tutorial and come back a month later to see how it’s doing. Your notes look like this. These are fictional figures for the example, not results from the screenshots:
| Measurement | Previous 28 days | Current 28 days |
|---|---|---|
| AI-report impressions for the page | 1,000 | 1,400 |
| Overall Google Search clicks for the page | 200 | 180 |
| Enquiries recorded from Google organic landing sessions in your analytics report | 8 | 9 |
You have more AI visibility alongside fewer overall search clicks: AI impressions rose 40%, clicks fell 10%, and recorded enquiries increased by one. That can be a puzzling result when you’ve just spent time improving the page.
The cause is still open. Perhaps the searches bringing people to the page changed. Demand may have shifted during the month. The revised instructions might also be more useful to the people who do arrive. These figures alone can’t tell you which explanation is right, or whether AI answers caused the click decline.
If you were sharing this with a colleague, a clear explanation would be:
The page appeared more often in AI answers this month. Overall Google Search clicks fell, while recorded enquiries were similar. Before changing the article again, let’s look at which searches brought visitors and whether the page helped them take the next step.
That gives you a useful next question without pretending the report has already answered it.
Look at what happens after the click
Getting someone to your website is part of the journey. You also want to know whether they found what they needed. For a service page, that might mean sending an enquiry or booking a consultation. For a tutorial, it could be downloading a resource that helps them finish the task.
In GA4, you can review the landing page with session source google and session medium organic. Then look at the relevant key events you’ve already set up and checked. These are Google organic outcomes; the comparison doesn’t identify which individual visitor arrived through an AI answer.
Don’t expect GA4 sessions to match Search Console clicks exactly. The tools count different things. You’re looking for patterns you can investigate, and Google’s guide to using Search Console with Analytics explains how to compare them.
If people arrive but few take the next step, spend a little time with the page’s copy. Does it match what they were looking for? Is the next action clear and useful? Our SEO copywriting guide explores search intent, readability, and writing around the visitor’s needs.
Keep any tracking changes in your notes, too. If you fixed a broken form event halfway through the month, an increase in recorded enquiries may simply mean you’re finally counting them properly. That detail changes how you’ll explain the result.
What if your report is missing or empty?
Opening a guide and then finding that your own report looks different can be frustrating. Before making changes to your website, check the account, property, dates, and filters. A narrow date range or a forgotten page filter is a much smaller problem to resolve than rewriting an article.
Google’s report help page lists insufficient AI impressions as one reason the report may be unavailable. It also retains some rollout wording alongside the worldwide-rollout notice. You can’t conclude from a missing report that your site has been penalised or has never appeared in an AI answer.
If the concern is about one particular page, its indexing and access details are a useful place to look. Check whether the intended URL is indexed and whether your robots.txt rules, CDN, and origin server let Googlebot reach it. You’ll also want to see whether the useful content is present when the page renders.
Preview settings deserve a look as well. Directives such as noindex and nosnippet can limit the appearance you’re expecting. Our robots meta tag guide explains preview controls such as max-snippet and max-image-preview, with implementation examples for Blogger. The first step is to find out what’s actually on your page.
According to Google’s AI eligibility and control guidance, supporting pages need to be indexed and eligible for a search snippet. Meeting those conditions makes a page eligible; it doesn’t guarantee that Google will choose it. The same guidance distinguishes Googlebot’s role in Search from Google-Extended’s controls for some other AI uses.
Once you’ve found a specific access or indexing issue, you can address it. An empty graph on its own isn’t enough reason to change crawl rules across your entire website.
When the chart and table don’t add up
You might add up the page rows and find they don’t match the property total. That doesn’t automatically mean you’ve made a mistake. Counting a website’s appearance and counting each of its pages can produce different totals when several pages from that site appear in the same result.
There are also limits to what you can see in a table. Google’s troubleshooting guidance describes a maximum of 1,000 displayed rows, along with differences caused by processing, time zones, and collection methods. Its guide to data discrepancies is useful when a comparison still looks wrong after you’ve checked the filters.
For your own notes, you can keep the property trend and the individual page’s results as separate observations. They don’t have to add up to the same total to be useful.
Use what you’ve learned to improve the page
After spending time in the reports, it’s natural to want to do something with what you’ve found. Try to name the problem in terms your reader would recognise. “This step needs an example” gives you a clear edit to make. “Improve AI visibility” leaves you with a goal but no explanation of what the page needs.
Return to that tutorial for a moment. If a reader has to guess which settings to choose, an example or screenshot could help. If the answer is buried under a repeated introduction, a shorter opening may make it easier to find. These are changes you can explain even before the next reporting period arrives.
Sometimes the information is already there, but the structure makes it hard to follow. A logical heading hierarchy helps readers find the section they need. Our guide to HTML page structure and accessibility takes that further with implementation examples.
You may also notice that the article assumes knowledge covered elsewhere on your website. That’s a useful place for an internal link. A reader who needs the prerequisite can follow it, while someone who already knows the setup can carry on. Our guide to internal links between related articles explains how to connect those resources, and descriptive anchor text helps readers know what they’ll find before clicking.
Readers also need to understand why they should trust the explanation. Where you have first-hand evidence, show the test conditions, relevant screenshots, and sources behind your advice. Our explanation of E-E-A-T introduces that editorial framework. E-E-A-T isn’t a numerical score you can increase by adding a byline or badge.
If you’re wondering whether you need special markup for AI answers, Google’s eligibility guidance says special AI schema or an AI text file isn’t required. Any structured data you do use should match what’s visible on the page. You can use our schema validation guide to get started with checking for errors.
Once you’ve made an improvement, note what changed and when. At your next review, you’ll have a specific edit to discuss alongside the figures. Search performance has many influences, so a before-and-after comparison still won’t prove that your edit caused every change you see.
Make the next review easier
You don’t need a complicated dashboard to begin. A short record for one important page can be enough to make the next review useful.
Alongside your dates, filters, and figures, write down what caught your attention, what you think might explain it, and what you plan to do. For example:
AI impressions increased, but overall search clicks fell. New readers may need more help with the setup. We’ll add a prerequisite section and a screenshot, record the publication date, and review the page after another comparable period.
That’s an example of a review note, not an account result. It keeps the observation separate from the explanation you’re considering. When you return, you can decide whether to keep the change, investigate something else, or reconsider your explanation.
Over time, those notes give you a useful record of what you’ve learned about your pages. Even when the numbers are inconclusive, you’ll know why you made each change and what you still want to understand.
Frequently asked questions
Can I track AI Overviews separately from AI Mode?
The current documented report combines them. You can look at different pages, countries, and devices, but those filters don’t separate AI Overviews from AI Mode. For now, label the result as their combined visibility.
Does appearing in an AI answer guarantee more traffic?
It doesn’t. Someone may get what they need from the answer without opening your page. That’s why it helps to look at AI impressions alongside overall search clicks and website outcomes when you’re deciding what the appearance means for your business.
Can I calculate AI CTR from total Google clicks?
You can’t get a meaningful AI CTR that way. Your overall Google Search clicks include a wider set of results than the AI impressions, so dividing one by the other would give you a misleading rate.
Should I rewrite every page without AI visibility?
You don’t need to. A page can still be useful to your readers and your business without a visible presence in this report. Give your attention to pages where you’ve found a real gap, outdated instructions, or an unclear next step.
What should I do first?
Pick a page you care about and save its current results with the dates and filters. Then write down the one thing you’d like to understand about it. You can build a useful reporting habit from that small starting point, without feeling you need to solve the whole website at once.
JOIN THE CONVERSATION
Comments
Have a question or something to add? Comments are moderated and appear here only after approval.
JavaScript is required to submit a comment. Published comments above remain available to read.
No approved comments yet. Be the first to join the conversation.